Dr.
Matt Nolan
Water
and Environmental Research Center
Institute of Northern Engineering
University of Alaska Fairbanks
matt.nolan@uaf.edu
|
|
Dr.
Matt Nolan |
|
|
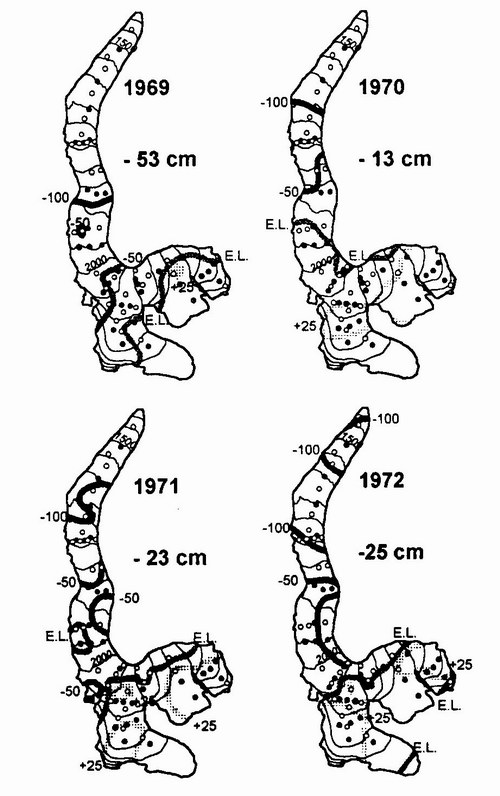
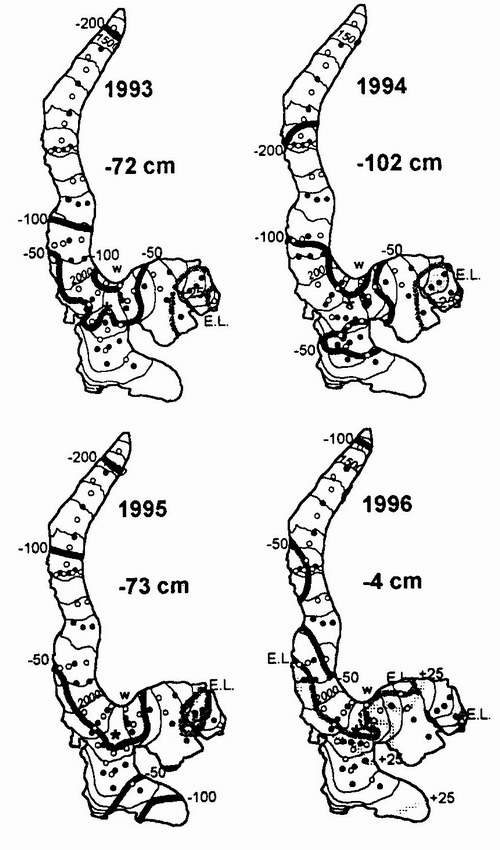
Example Analyses Shown below are some examples of the work that has already been done on McCall Glacier, starting with the late 1960s. As our research progresses and papers are published, I will continue to update this page. Mass Balance The plots below were created by Bernhard Rabus for his thesis work. They show the distrubution of mass balance over time, beginning with his reanalysis of the 1969-1972 work, as well as the glacier wide net balance. Mass balance has been negative in every year measured, though substantial inter-annual variations exists. The 2002-2003 balance at individual stakes most closely resembles the 1996 contours, but we have not yet worked up the calculations using the same algorithms that produced these plots. These plots use the stratigraphic method and balance map methods.
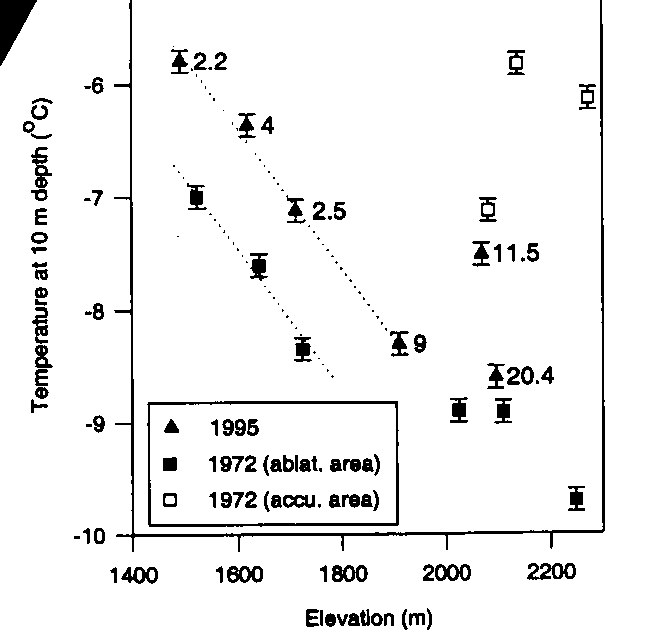
Ice temperature I find the ice temperature record on McCall Glacier one of the more exciting quantitative studies. Shown below are data from 1972 and 1995 from several locations on the glacier, taken from Bernhard's thesis. The more interesting points are those shown attached by the dotted lines, which are measurements made in the ablation area. Here, the heat released from freezing of internal accumulation is not affecting ice temperature as it does in the accumulation area, and the points connected by dotted lines are not affected by advected heat from the accumulation area, as they are far enough from that zone that the warmer ice has equilibrated to local air temperatures. The slope of this line is essentially the local mean annual lapse rate. Some modelling was necessary to account for ice surface lowering and spot measurement techniques, but the data unambiguously indicate that about a one degree increase in air temperature occurred between 1972 and 1995. We are repeating these measurements now, and will soon now how things have changed over the past 10 years.
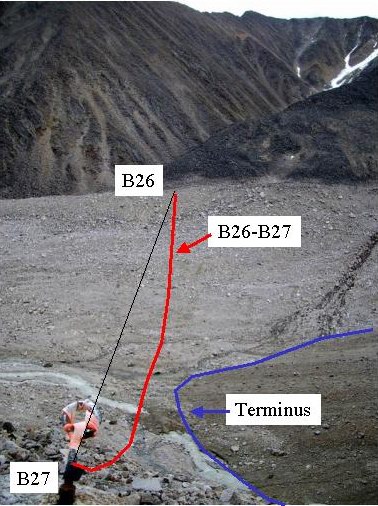
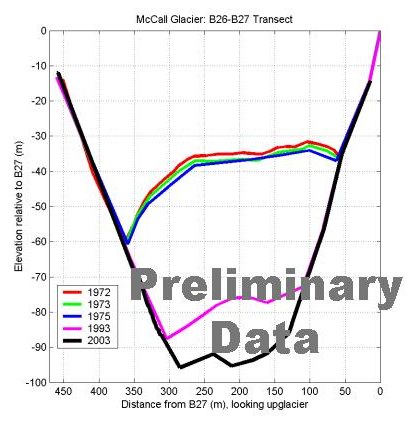
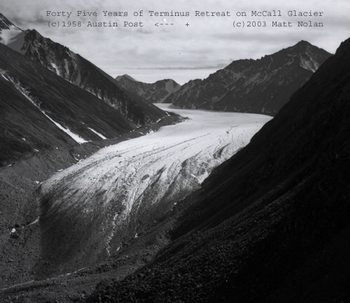
Transects We are fortunate that surface elevation has been measured along several transects for more than 30 years. Since the last measurements were made in 1995, the glacier terminus has retreated back past the lowermost transect (B26-B27) and there is no longer any glacier ice to measure.
The B26-B27 is the furthest transect shown below. The upper transect (B1-B2) still has plenty of ice beneath it, so we should have enough ice left to measure for the duration of our current project.
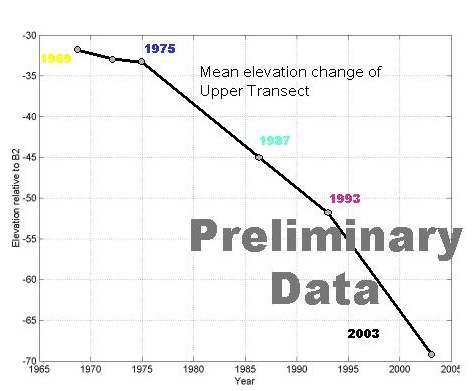
The figure below is derived from the plot above
and an earlier version of it (without the 2003 measurements) has been
reproduced in many publications because it clearly indicates that the
rate of surface elevation change has increased over time. Care should
be taken when using this figure, however, because it does not account
for flow dynamics. We are currently working on a similar figure which
plots glacier-wide volume loss over time with the same time steps, which
does account for both mass loss and flow dynamics
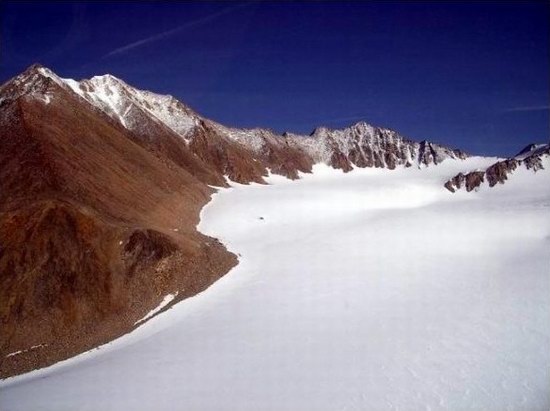
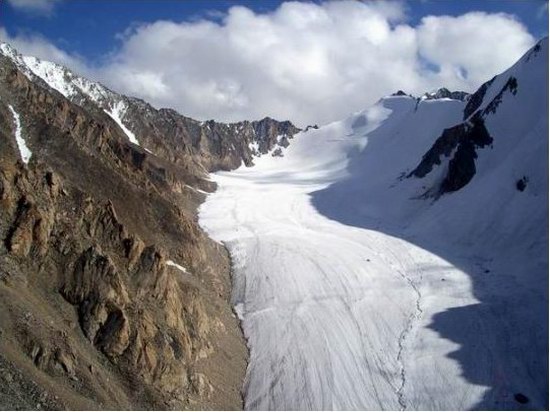
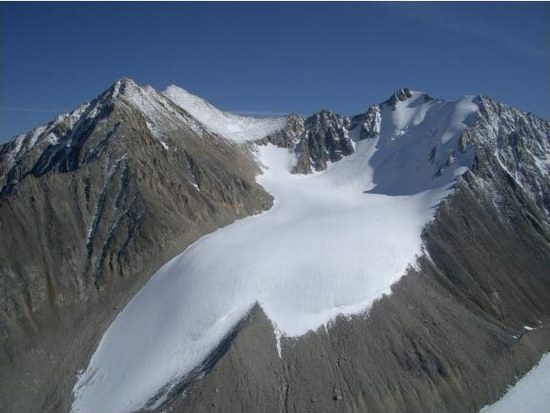
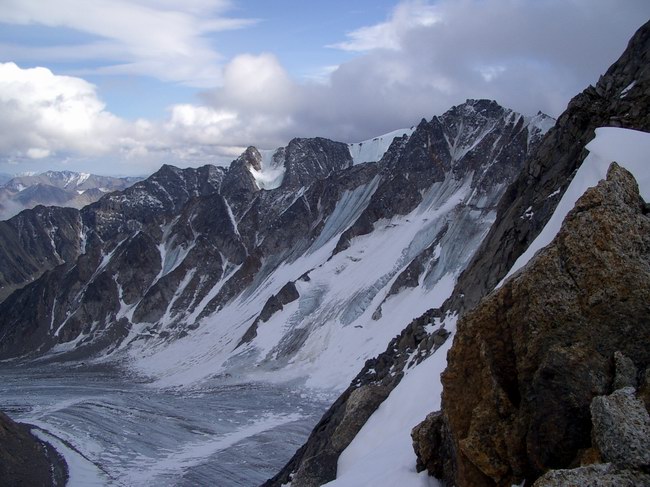
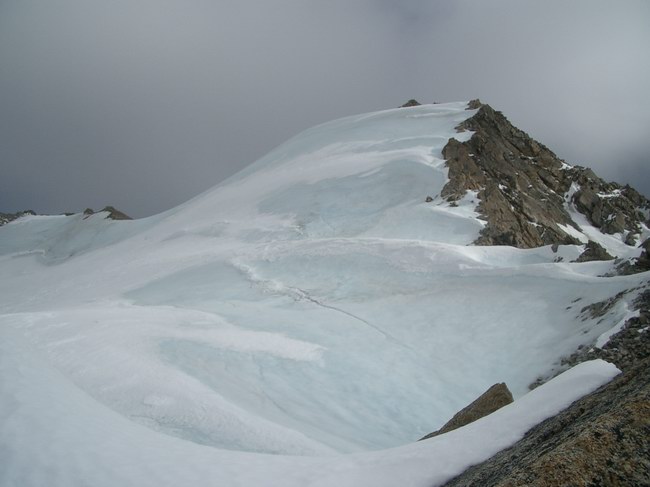
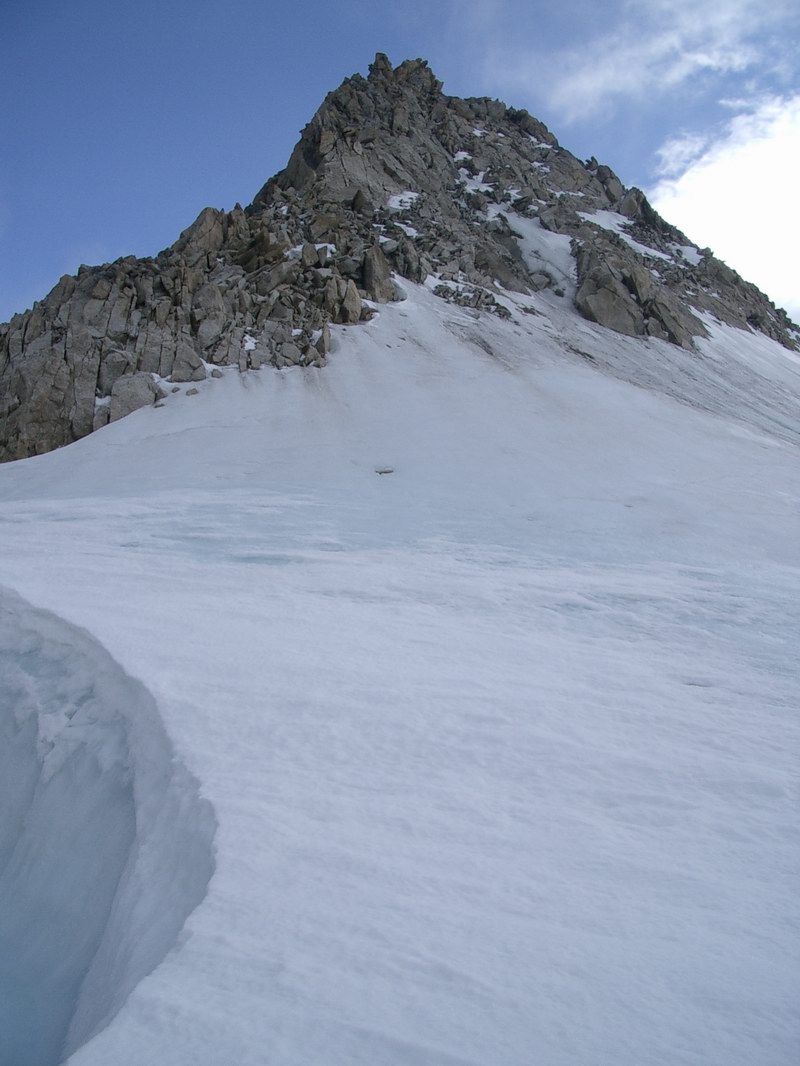
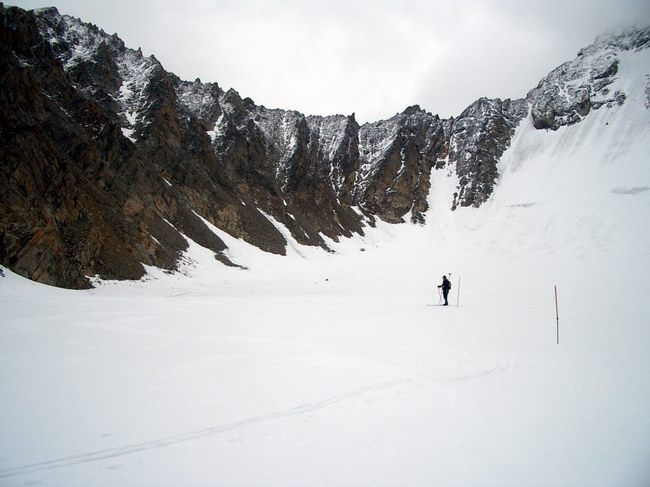
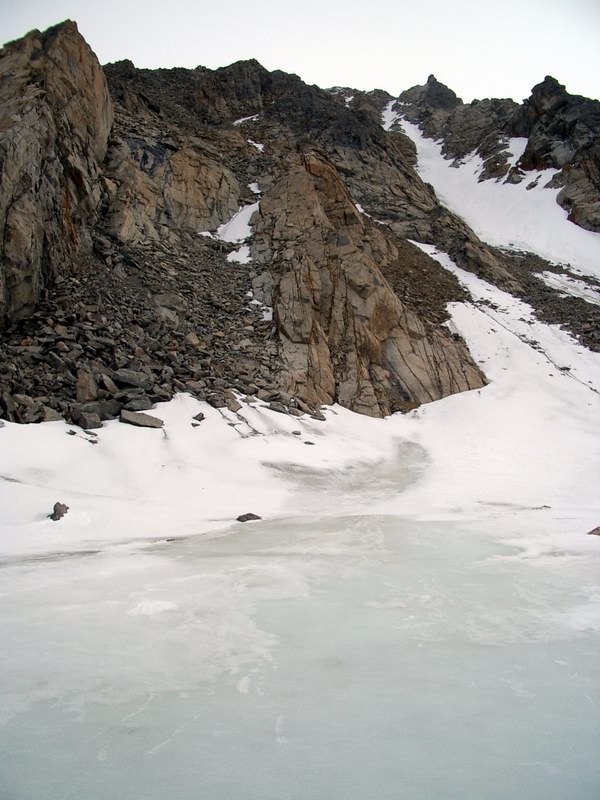
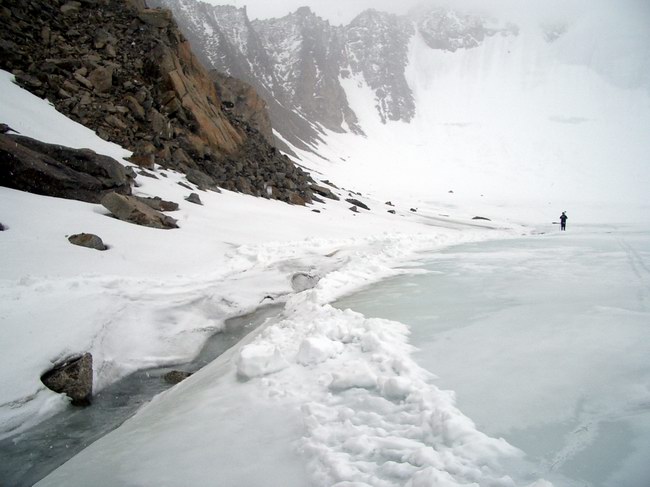
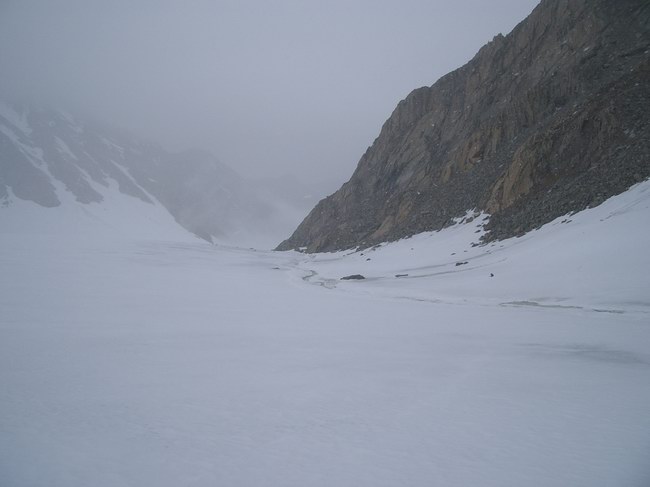
Ice Veneers One of the more intriguing processes I find occurring around these glaciers is the distribution of ice on the steep slopes surrounding them. It would appear that solar radiation plays a dominant role in dictating where ice can form. The three images below were all taken looking east, with north facing slopes to the right. Note that the rims of the mountains within each picture are all at about the same elevation.
I believe that at least some of the ice found here was not formed by the classic textbook process of snow compaction into ice, but rather more like the formation of aufeis and overflow. That is, the standard glacier facies proposed by Benson may not apply to steep facing slopes. At the upper end of these steep faces, I found little snow at the end of winter, and significant amounts of liquid water in summer, well above the snow accumulation areas of the lower lying 'textbook' glaciers. Here, the slopes may be too steep for snow to keep from sliding, whereas more accumulation can occur on the flatter ridges above. The snow that does stick begins to melt in summer, dribbling down the slopes or appearing from springs, where it often refreezes. At least some of the water that does not freeze on the surface continues down further and enters the snow pack that is typically in the form of an avalanche cone, where at least some of it likely refreezes and eventually becomes glacier ice. This ice releases a lot of its heat in winter, allowing snow to stick longer on it in summer because it is not losing as much heat from below as it might on rock. In low mass-turnover glaciers like those found in this region, this internal accumulation may be a significant source of mass gain. However, slope plays a role in this as it may only occur on the north facing slopes. As the slope gradually turns to the east or west, much of the water that ponds within the snow packs seems to form slush flows before refreezing, creating a stream between the mountain and the glacier ice which then carries off any additional run-off from the steep ice slopes. Further, these streams begin to incise a channel between the two, exposing rock at the glacier margin and changing the local surface energy balance, enhancing ice separation from the glacier. Such streams can be found well above the mean equilibrium line. I believe that dynamics along these lines may play an important role in glacier genesis and demise in the Arctic.
|
(c) 2003 Matt Nolan. If you find any broken links or other errors, please let me know. Thanks.